Saturday, June 11, 2016

SNOW??? SNOW!!!

edit: I posted this the morning of 6/11, but by early afternoon, I had already made some tweaks. So, I'll add some minor edits to the original post below...

SNOW!!!

Inside voice, Adam.

In recent weeks, I had spent some time mucking around with Nasa's MODIS satellite imagery to try to deduce the size and extent of the Sierra snowpack. This is exactly the kind of problem that piques my interest. Usually, when I encounter these kinds of problems, I throw a few hours at it, do some really interesting stuff, but leave it incomplete and undocumented, because I saw something else shiny.

Well, this time I pledged to tug it a little further along, so I have. In typical Sierra Mapper style, this feature has been thrown in with abandon, mashed into a hole in existing code.

I'm still not sure what you're even talking about.

You'll see a new button at the bottom of the calculated route page, with a cryptic and exciting label of Snow?!? on it:

Like any good GUI designer, I placed the button for the exciting new feature buried at the bottom of the laundry-list of existing buttons

When you click on the Snow?!? button, you'll be whisked off to another screen. The screen is pretty plain, but shows three elevation profiles for your route. In atypical Sierra Mapper fashion, the elevation profiles are not very edit: somewhat fancy.

The red colored highlighted sections on the profiles denote sections that I declare are snow-covered. That declaration is rooted in image processing and threshold analysis of MODIS satellite imagery, geo-referencing of the resulting snow-cover array, and interpolation of that snow-cover array along your route. The top profile is from the most recent imagery, the one below it from slightly older imagery, and the one below that from a even older.  (Edit: now there's just one profile that is a rainbow of color and information). The point is to look at snow coverage on the route, and look at the dates, and think wistfully about your trip, convincing yourself that that there will or won't be snow, depending on your preference.

You should see something like this. See how there's more on the route that's red on 5/22 (bottom) than there is on 6/03 (middle) and 6/09 (top)? Neato. The red text indicates th
e fraction of the route that's covered in snow.(Edit: Old!)

Edit: New! Way much more fancier-ish, and easier to interpret to boot.

Caveats
Well, there are quite a few of these. First and foremost, I haven't calibrated this approach with even a modicum of rigor, so I'm not sure how sensitive it is to snow cover. In other words, I don't know if 50% snow cover will trigger my analysis to report an area as snow-covered, or 80% or 10%. Ultimately, it simply has to do with the reflected light back to the satellite and the brightness (and whiteness) of the corresponding pixel in the satellite image. Since that will be affected by tree cover, by time of day, and by color temperature and brightness of the satellite image itself, there are a lot of variables that undoubtedly have an impact. Still, the approach finds that the entire Sierra is covered in January, and that none of it is covered in September, so it certainly works--but again, there is the question of sensitivity.

I hope to write more about the process in the coming weeks, and add both features and some polish. Still, I'm haphazardly throwing this feature up now in order to get it out while it was still relevant--adding this in August of a low-snow year would be a lot less interesting.

Lastly, as usual but especially since this was so hastily put together, please report any issues you encounter!


Friday, February 19, 2016

Hello? Is this thing on?

Hellllloooo! (<- and that's a Seinfeld quote)
After such a long hiatus, you might expect a tremendous, ground-breaking update, with fancy new features and optimizations to make Sierra Mapper even speedier than ever!

Unfortunately, you'd be (mostly) wrong.

I have spent the last few days in a rare flurry of fingers; updating code and rubbing my temples; doing my damnedest to remember how this whole thing works. The result: I do have a barrage of trivial changes!

The good news is that I'm throwing more data in your face! Yay! You can take this data and spreadsheet-nerd long into the night!

The bad news is that all routes will have to be recalculated. Links to existing routes should still work just fine, but the first visit to those routes will be painfully slow. Fear not; subsequent visits should be snappy.

I've run out of things to say that aren't the trivial updates, so without further ado, here's a summary of the updates in the order of impo that I can remember them:

  1. Downloadable .csv tables with route information
  2. Downloadable .csv files with elevation profiles, so you can geek out creating and labelling your own elevation profiles
  3. Improved label economy on profiles! Hopefully, no more stacked-label-fests that used to occur around areas with many features
  4. 400% more excitement on that boring cumulative ascent/descent graph
  5. Improved accuracy on the real-time route distance calculations
  6. A database that is now (hopefully) usable
  7. A donate button (really more of a feature for me than for you, to be honest)
Lengthy descriptions of these follow, including pictures and rambling monologues on other topics that I have feelings about.

Trivial Update #1: Downloadable .csv data tables with route information
I am admittedly biased, but I think Sierra Mapper is great tool for the early stages of route planning. You can pick a trailhead, and in minutes, have a good sense of what on-trail options exist for adventures in your mileage range of interest. Sierra Mapper does this equally well no matter what trailhead or route, but that flexibility comes at the cost of its specificity, and ability to provide even more detail for features of interest and importance, while rejecting those that are inconsequential.

I struggled for a while with how to deal with this; I toyed ideas of other ways of presenting route data. Yet all of the approaches I could come up with came at the cost of reduced generality and decreased utility for some aspects of some routes.

"Not Good!", said I, squinting at my supposedly route-agnostic planner.

Ultimately I decided that perhaps diving into greater detail is best done by you, the route planner, in whatever fashion you prefer to. But at the least, I can help--I can aim my digital fire hose at you, and provide all the detail that I have for each route .

And that brings us to the downloadable .csv tables. When profiles are generated, Sierra Mapper tries to pick and choose what to show you, and what not to show you. It does a pretty good job, but I want you to have the whole kit-and-caboodle...

So BAM! Now you have it.

To download the table, simply calculate a route, then click on the gray "Download Data Table" button. It's located at the bottom of the Route Summary, and looks something like:

 
After clicking on the button, you should be prompted to open or save a .csv file. If you open it in csv-friendly software, you should see something like this:


Hooray, data!

The column headers make the content pretty obvious, but here's a brief explanation:
  • Profile Label Number - If you look at the elevation profile, you'll see the numbers on the labels correspond with certain rows in the csv. The Profile Label Number provides that correlation. If the Profile Label Number is 0 or -, it means the label was either combined  with the preceding label or omitted from the elevation profile.
  • Point Number - This refers to the index of the point in the elevation profile. What use is that to you, you say? You don't have the elevation profile data itself? Maybe I wrote these updates in the wrong order. See Trivial Update #2: Downloadable elevation profiles.  Example: If the Point Number is 72 it means the label belongs in the 72nd point of that mysterious downloadable elevation profile I keep alluding to.
  • Cum. Distance - Cumulative distance. Why are you smirking?
  • Cum. Terr. Distance - Cumulative terrain distance. Same as above, but now the 3D path length of the trail, rather than the 2D projection of it. 
  • Elevation - If I have to explain it, you probably don't belong here. Bah, now I feel guilty. It's the elevation of the point. In feet. Above sea level. C'mon.
  • Cum. Ascent - Cumulative feet of ascending. Calculated with signal processing magic!
  • Cum. Descent - See above; same magic.
  • Label - This is the text that appears (or would appear) on the elevation profile
  • Lat. and Long. - If you don't know what these are, then go learn something. Go ahead. I'll wait.

Trivial Update #2: Downloadable elevation profiles

There was a spoiler above; I know.

You know those pretty elevation profiles that Sierra Mapper effortlessly creates for you? Well, now you can it yourself, too! Of course, it'll take you far more effort.

Combined with the data table above, you can create custom elevation profiles, that include the details you care about, and omit those you don't.

Go back to the Route Summary page - the page you're taken to just after calculating a route, and scroll down again. Do you see the button that says "Download Elevation Data"? Guess what that does?


Yep! Click it!

Open the file provided in your preferred csv manipulating software: Excel if you're adorable when you do math, MATLAB if you got an engineering degree 10 years ago, or Python if you're enlightened.

If you're adorable, you should get something like this:


Hooray, data!

I opted out of abbreviation in the column headers, so they require no explanation (and induce no snickering).

If you highlight a bunch of column A and B, and create a chart, you should get a pretty crummy chart like this:

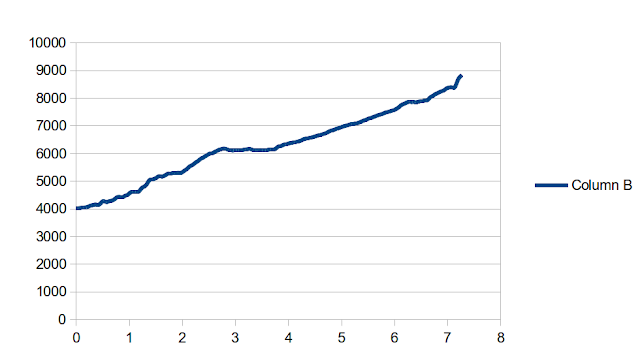
"Why, that's the same elevation profile as my route!",  is what you might be saying, if you have terrible foresight.

Now it may be a crummy, label- and unit-less chart, but it's yours - yours to manipulate, and fiddle with, and annotate, etc. Who knows--maybe somebody out there will create elevation profiles that are stylistically better than Sierra Mapper's1?

Trivial Update #3: Improved label economy on profiles
As controversial as label economy might be, I will not only broach the topic; I will now drone on for quite a while about it.

One of the problems that exists in Sierra Mapper is that, well: when there's a bunch of shit that's close together, labels get awful. They get crammed together and end up floating 30,000 feet above the surface of the Earth. Who can even read them way up there? Nobody backpacks with a telescope.

I've added some logic for better combining of labels, and some shortening of the text when it becomes unwieldy. See this before and after:

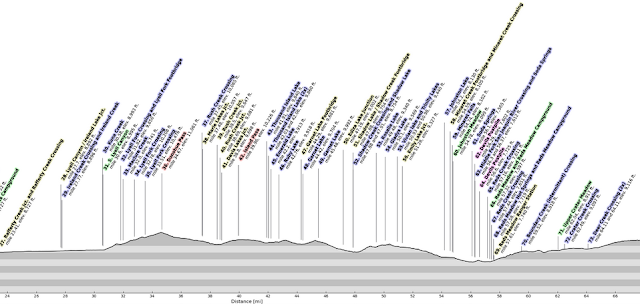
Old Version: Pure chaos.
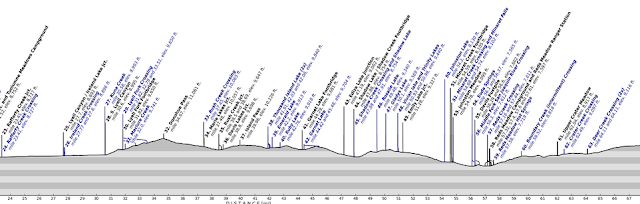
New Version: 3% less chaos.
There are a few other changes, too: I've gone away from color-coded labels, except for water features; those are blue (and italicized); everything else is black. I was never really convinced that the color-coding added much value, and it made the labels slightly harder to read. Did you prefer the color-coding? If so, tell me--this is for you2?

In instances where labels have been combined, I've added neat swoopy curves to tie the points together. Here's a better look:

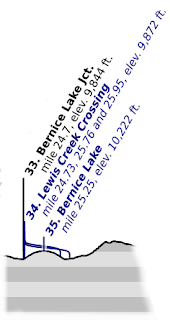
I did warn you that these updates were trivial.3
Trivial Update #4: 400% more excitement in that boring cumulative ascent/descent graph
I work with data quite a bit, and I have to present it quite frequently. Effective presentation of data is a few parts art, a few parts science, and a few parts sociology.

There is one universal truth: if the presentation of a given set of data is weak, and you don't know how to fix it, annotate. Annotate the heck out of it. If you do that, then maybe people will be too busy reading the annotations to notice that you don't really have a point to make with the data.

That's not a particularly endorsing segue, is it?

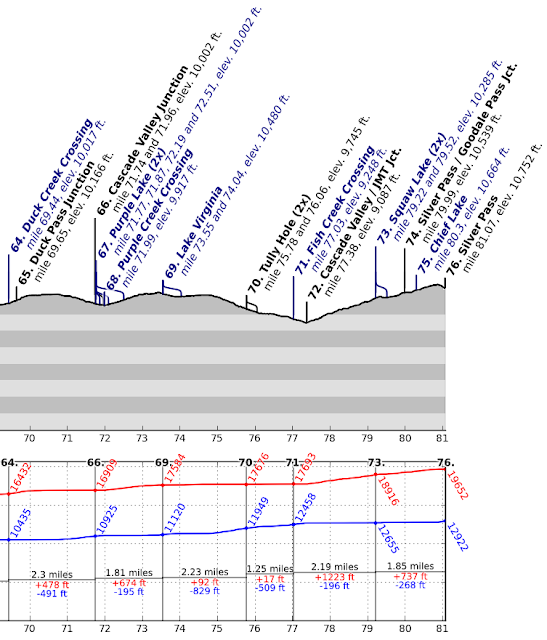
The NEW and IMPROVED cumulative elevation change graph has been annotated. It's had the heck annotated out of it.

But I do think the product is better. An excerpt is below:

Hooray, data!
A brief explanation:
  • See those big fat black numbers at the top of the bottom chart? Those refer to the numbers of the profile labels above. Some get skipped, because I couldn't cram all the annotations in the bottom plot. So you have to look at the big fat black numbers to figure out which profile labels you're comparing.
  • See the red and blue numbers that are tilted at 60 degrees? Those are simply labels on the cumulative ascent (red) and descent (blue) curves that indicate their values (in feet) at that location.   
    • Example: When you reach Label 66. (Cascade Valley Junction), you'll have done 16,909 feet of climbing, and 10,925 feet of descent on the entire route, up to that point.
  • The black, red and blue horizontal labels indicate the mileage, ascent and descent between the two indicated locations
    • Example: Between Label 66 (Cascade Valley Junction) and Label 69 (Lake Virginia), you'll go 1.81 miles, climb 674 feet, and descend 195 feet.
It is a smorgasbord of annotations, but I think it's much better than the wasteland that previously existed. It required extensive visual interpolation if you wanted to make any sense out of the graph, and the aspect ratio of the graph didn't help any.

Trivial Update #5: Improved accuracy on real-time route calculations
This was an easy but desirable fix: Now, when planning a route, the indicated on-the-fly mileage shown on the mapping page will match the calculated route's mileage. So, you only need to calculate the route if you: want to see the profile, want to know how much ascent or descent there is, or want the link to return to the route later.

Nifty!

Trivial Update #6: A (hopefully) usable database
The route database should be a pretty useful thing, since it should allow you to easily revisit routes you've previously planned.

Unfortunately, trying to actually access the database requires a three minute wait, and returning to the database from any entry requires the same wait.

I may have fixed the problem by reducing the resolution of the profiles displayed in the database. This shouldn't negatively impact functionality, because the old ones were so tiny you couldn't make heads or tails of them anyway. The new ones are simplified, but at least give you a sense of the profile:

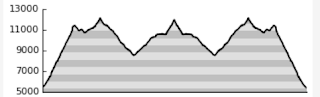
Real mountains aren't this stripy

Time will tell if this is enough to keep the database snappy.

Trivial Update #7: A donate button
Ah, the best for last.

Sierra Mapper has been happily chugging away for the last year; CPUs in some closet in Arizona hum while screaming through billions of ridiculous floating point calculations, all to determine just how many times you crossed the South Fork San Joaquin.

Sierra Mapper gets a few thousand hits per day, leaving many (hopefully) satisfied customers walking away, routes in hand; eyes sparkling with thoughts of their upcoming adventures.

I haven't dedicated much time to Sierra Mapper in the last year. Depending on responses to these updates (and usage of said donate button) I may or may not spend much time on it in the future. It works; it has lovable quirks, but it works.

Still, I pay for operating costs out of pocket, and I doubt I'll want to do that indefinitely. I refuse to add advertisements as a solution--that's a piece of capitalism that I want no part of.

So this is my first attempt at a solution: a donate link. It's located both on the title bar of this blog, and at in the header menu of the app itself.

A few generous souls have already asked how they could donate, and have sent donations. I am wholly grateful for them, and they've offset the costs for part of the last year.

What I ask of you is simply: if Sierra Mapper is useful to you; if you'd like to see it continue to exist, and especially if you'd like to see it grow and improve, send a donation. Doesn't have to be much. A few bucks. If everyone who used Sierra Mapper did that whenever they actually took a trip--a few times a year; sent $1 or $3 or $5--I think the site would be self-sufficient. Heck, might even be able to hire a real programmer to fix some of the garbage4 !

This isn't a cash-grab, or extortion--I'm simply trying to determine if it's worth it to keep the site running.

If you do send a donation, no matter how small; if there's a feature, function, or mapped area you'd like to see added, send me a note using the contact form to the right.


1 Naw.
2 Except you, Darryl. None of this is for you.
3 If you find yourself squinting at the swoopy curve, wondering whether or not it's a hyperbolic tangent function, wonder no longer: It is!
4 Probably shouldn't call it garbage in the donation section.

Monday, February 2, 2015

Scope explosion! ...but let's just call it an open alpha

Last November, I started to tinker with Sierra Mapper.

Initially, I just wanted to add off-trail travel.

Once that was working, I was dissatisfied with the major drawback--that there were no labels on the elevation profiles for the off-trail segments. To add labels to the off-trail segments would require a total revamp of how the profile labels were generated. Total revamp--no problem. I dug in.

I soon1 had that working, and with a bit of algorithm massage, reduced the amount of time it took to generate the profiles to a palatable amount.

"Cool," I thought, "Time to share this with all the people that care about Sierra Mapper2!"

But I didn't, because then I decided that adding kml importing should be pretty easy--I had the labelled profile problem solved for arbitrary paths, after all. And how about a route database? And in that database, can I include links to useful things?

Oh, and the on-the-fly route calculations--I should improve that.

So I did all that. But I didn't stop along the way to fix the bugs, and still haven't done it because fixing the bugs will be a lot of work, and if this isn't moving in the right direction, there's no need to spend my free time chasing out-of-whack counters and sluggish Ajax requests.

So--intrepid mapper--take the alpha for a spin. There's a link to it above (and also here: OMG!).

I'll detail the added features, how to use them, and the known bugs in upcoming posts.


1 "Soon" in the geological timescale context
2 Both of them

Nobody likes a blog post without any pictures


Monday, October 27, 2014

A New Beta!

After a handful of incremental changes, I'm releasing a new Beta! You can access it via the link below the banner above, or by clicking here.

A quick summary of the changes:
  1. Shaded-relief USGS Quads are available (and are now the default). Big thanks to Matt at CalTopo for generously offering to share his seamless tiles!
  2. Route segments are now shown on-the-fly when planning a route. These segments are either shown as straight-line distances with a black dashed line ("un-calculated" segments), or segments of the routed trail highlighted in purple ("pre-calculated" segments)
  3. Distances for each segment are now shown on-the-fly when planning a route
  4. An "Edit this Route" button was added to the route and profile page. This returns you to the planning page, with the existing route entered, and a suitable view chosen, and prevents you from having to start from scratch for tweaks to a route.
  5. Signal processing was added to the distance and elevation change calculations. This is largely empirical, and is aimed at reducing systematic errors in elevation change and distance.
  6. Both the routes and the profiles from complete routes are learned, so that subsequent calculations of that identical route are vastly sped up

Planning a route in the Beta: Shaded-relief USGS Quads, and segment highlighting and distance calculations on-the-fly!
That said, let's dig into the details...

1. USGS 7.5" Quadrangles and shaded-relief tiles
Matt at CalTopo generously offered to share his USFS, shaded-relief, and USGS quad. tiles. So far, I've only integrated the USGS quads and the shaded relief tiles.

The new tiles will be selected as the default, but if you want to return to the Google terrain (or map, or satellite imagery) tiles, there's a control block in the upper right that can be used to do so.

I added the shaded relief as a transparent overlay (at 30% opacity) to all baselayers. This works well on all maps except the Google Map terrain map, which is already shaded, and becomes a little contrasty with the additional shading. I'll probably change inclusion of the shaded-relief to an option at some point. If you hate the shaded-relief, let me know, and I'll make this a higher priority.

I'm thinking about including other baselayers as well. OpenStreetMap is an obvious choice. I'd like to make maps of my own, but that's quite an undertaking.

Baselayer map selection in the upper right-hand corner

2. Route segment highlighting/indication on-the-fly
In the original Sierra Mapper, one of the things I didn't like was that once you had a few yellow vias included in a long route, it was hard to follow the order of the vias, and therefore hard to follow where the route went.

My first stab at rectifying this consisted of connecting the input nodes with straight lines. This worked reasonably well--you could track the order of the input route fairly intuitively.

But then I realized that doing better than that probably wouldn't be that hard. Wouldn't it be great if it could highlight the actual route?

The trouble was that the actual route is determined from a call to the Python code that solves Djikstra's algorithm for the trail network. There's no simple way to do this in real-time (unless all of that code is ported to Javascript--any volunteers?!?).

The brute force method would be to pre-calculate all of the shortest routes, and the array of coordinates that  corresponds with each route.  To do so for all routes between all nodes would require n(n - 1) individual routes and corresponding coordinate arrays, where n is the number of nodes in the network. With the current size of the trail network n = 1,250; n(n - 1) is around 1.5 million.  This would be cumbersome--and unnecessary.

So I settled on brute-forcing the routes, but only on a subsection of all possible routes: routes that connect nodes within two miles of each, and routes that have previously been calculated. In other words, whenever someone calculates a route, the segments of that route are learned, so that in the future, when identical routes are input, the route (and coordinate array) can be recalled. Likewise for all segments between nodes that are within 2 miles (as the crow flies) of each other.

There's definitely some optimization to be done here. The routes are currently saved and loaded from .csv files. This is inherently inefficient. I think a SQL database would be a better way to implement this, but my knowledge of SQL is virtually non-existent. But, at least for the Beta, this approach works...

Route highlighting on-the-fly in King's Canyon: The first segment (from Road's End to Mist Falls has already been calculated, so the route is highlighted in purple. The second segment, from Mist Falls to Sphinx Junction, has not been pre-calculated, so it's shown as a straight line.


3. Segment distances on the fly
Like the route indication on the fly, segment distances (and the cumulative route distance for all segments) are shown on-the-fly during route planning.

The same caveats for pre-calculated vs un-calculated routes apply here, so I won't belabor that again. Essentially, the routes that are pre-calculated have known distances; the routes that aren't pre-calculated have unknown distances.

In an effort to do a little better than to say that "nothing is known for the un-calculated segment length", the straight-line distance between the two nodes is calculated and shown, caveated with a greater-than sign to indicate that this is the minimum possible length of the segment.

The same route planning exercise from above, with the on-the-fly distances shown in the "Entered Route" box on the right. The segment between Road's End and Mist Falls is pre-calculated, so the correct distance of 3.67 miles is shown. The segment between Mist Falls and Sphinx Junction isn't pre-calculated, so the straight-line distance is shown, caveated with a greater-than sign: >2.39 mi. The total distance is the sum of the segment distances, which is still caveated with the greater-than sign (>6.06 mi).

4. The "Edit this Route" button
In the original Sierra Mapper, the browser's "back" button booted you back to the planning page, with an empty route and a view of the entire Sierra Nevada.

Browser "back" buttons still function this way, but in many (most?) cases that one wants to go back, it's to slightly modify the existing route. That's what the "Edit this Route" button was made for.

You'll find it at the bottom of the route/profile page. Clicking on it will take you from your routed/profiled route back to the planning page, but will retain the input node queue, and will select an appropriate map zoom and center. 

The "Edit this Route" button, at the bottom of the route/profile page

5. Signal processing to minimize systematic errors in distances and elevation changes
The method of calculated distance and elevation change--which I haven't thoroughly explained yet on this blog--essentially relies upon accurate route placement, and good elevation data from the USGS.

Errors in both of those lead to errors in the calculated distance and errors in the calculated elevation change. 

Distance changes tend to be systematically short. This is essentially because the NPS shapefiles (and the trail routes as illustrated on USGS quads) used as the main input for trail location tend to omit switchbacks and minor deviations in the route. These small errors accumulate, and result in distances that are short by anywhere between 0% and 10%. Gross errors in trail location should be fixed not by empirical tuning factors, but by fixing the route. But an empirical factor to correct for the lack of "smoothness" in the input trails seemed reasonable. I used 3%--this gave decent agreement for the calculated distances of well-known trails (The Beta calculates the distance of the JMT as 214.02 miles, while 210.4 miles is commonly cited).

Errors in elevation change are slightly more complicated. They occur primarily because a) the trail route contains error, which routes the trail up and down the surrounding terrain erroneously, or b) the underlying elevation data either contains errors, or is of insufficient resolution for these calculations. These errors typically manifest themselves as either large erroneous ascents/descents (in the case of a) ), or fast up-and-down "jaggies", in the case of b).

Again, a) should be rectified by improving trail locations.

To address the errors in b), signal processing was added; the elevation is interpolated to approximately 30 meter resolution (the resolution of the underlying USGS elevation data), and then filtered backwards and forwards with a low-pass Butterworth filter. This tends to reject errors from using trails that have higher resolution than the underlying elevation data. Since the interpolation is done at the resolution of the underlying data, rejection of real elevation changes should be minimized. 

6. "Learning" Routes
The signal processing mentioned above introduced measurable slowdown in the performance of the routing algorithm. To counter this, I implemented a change whereby routes that have been previously calculated are no longer re-calculated when a subsequent user follows the link. Doing so was wasteful, anyway.

As a result, viewing a route that has been previously calculated is many times faster than calculation for the first time.


Tuesday, August 19, 2014

More SEKI, More Happy!

Non-trivial update! The entire High Sierra Trail has been added!

..AND Elizabeth and Colby Pass have been connected to Sequoia National Park from Kings Canyon National Park!

..AND Lake South America and the surrounding trails in Sequoia National Park!

Expect more updates to Sequoia National Park in the coming weeks.

The High Sierra Trail--highlighted above--and more!
1,663.9 miles of routable trails, and counting...

Wednesday, July 16, 2014

Minor Update!

It's not much, but a few trails have been added and fixed:
  1. South of Sonora Pass, in Toiyabe National Forest
  2. Between Johnston Meadow and Minaret Lake and Mine, in Inyo National Forest
  3. Between the JMT and Castle and Emily Lakes, in Inyo National Forest
The entire PCT between Crabtree Meadows and Sonora Pass is now mapped! Hooray!

Fixed some missing segments near Sonora Pass (left), and added more trails in Ansel Adams Wilderness (right)
1,582.4 miles of trail, and counting...

Sunday, July 13, 2014

...And we're live!

Greetings!

A momentous day is upon us.

You--my dear friend--are witness to the inaugural post for the Sierra Mapper web application. 

Grab a cup of coffee, cozy up to your phone/tablet/computer, and let's chat a little bit about what Sierra Mapper is.

So what even is this thing? This "Sierra Mapper"?

Patience, dear reader. Like most bloggers, I'm going to tell you a long-winded, self-absorbed story to answer your simple question.

Like many great ideas, this one was born from some blurry amalgam of little pieces of things that I noticed were missing.

From seeing online forum-goers, wordily describing hiking routes in the Sierra Nevada to other forum goers:

"Yeah, head up Paradise Valley, but instead of crossing Wood's Creek, keep going north, and then maybe 1/4 mile before the Baxter Pass junction--that's the first main junction--..."

A highlighted map would communicate this far better. But where could one get a highlighted map?

From trying to plan routes in the Sierra--using spreadsheets, and Tom Harrison maps, and lots and lots of time. And still not being able to easily figure out elevation profiles. Looking in disdain at my DeLorme Topo 9.0 DVD--that should help with this--but it won't run on Linux, which is my OS of choice these days. Damnit. Why isn't there a web app that can do this?

From a lot of clicking in CalTopo:

"I can put my route in here, perfect!"

click-click-click...click-click... 

"Switchbacks...my god, this is a lot of clicking"... click-click-clickclick.

How many people have already clicked this route in? How many have to before we find a better way?

The fix--for all those things--and more, is Sierra Mapper.

I still don't get it--what is Sierra Mapper? Some kind of web app?

I actually wasn't finished--I was pausing for dramatic effect.

But yes--it is some kind of web app.

The awesome kind, because it's free, and it's useful, and--while not perfect--does those things above.

An excerpt from the output of a route through Evolution Basin. Highlighted map on the left, beautifully labelled profile on the right. Well done, sir. Well done.

Okay, so how can I use it?

To get to the web app, just click on "Go to the Web App" below the banner on this very blog. Or navigate to https://awhite4777.pythonanywhere.com/SierraMapper/default/start.  Once there, click on "Instructions" in the lower left for a brief run-down--I hope you find it is quite straightforward.

Is the web app finished?

Oh--oh no. No, no no. Absolutely not.

It is far--very far--from finished. It is a fawn, with knees-knocking--looking at the world with wide-eyed curiosity. It doesn't know what it will become, and the world doesn't know what to think of it yet.

And it's probably pretty buggy.

But it works well enough to share at this point, so I implore you, dear reader, to try it out.

And please leave me feedback--what works, what doesn't work, which trails you'd like to see added--where you'd like it to go from here.

You can contact me either by leaving a comment here, or by using the contact form to the right.

This is getting pretty long winded.

I have much more to say, but I will acquiesce, and defer it to later posts.

Now go forth, learned reader! Map routes and compare routes in the glorious Sierra Nevada with minimal clicking! And gaze in awe at beautiful profiles!